7 essential tools for web performance audits
Part 2 of our React Performance series
Welcome to the React Performance Optimization series on systemseed.com. It’s a practical guide to improving performance of mature or even legacy React websites without significant refactoring. In Part 1 we listed some low-cost optimization opportunities that don’t require deep analysis and refactoring. Follow us on Twitter to read the next parts as they get published.
Now it’s time to dig deeper into the analysis of the site. The following tools (all free!) will help us identify the most impactful performance optimizations. As of 2021, most of the suggested tooling is maintained by Google.
Lighthouse
Google Lighthouse is a de-facto standard for measuring the quality of web pages. It's available in Chrome DevTools and as a CI tool. Run Lighthouse regularly to see how your changes affect web vitals. Javascript-specific opportunities offered by Lighthouse are not always useful, but at least it's a good starting point.
Performance optimization is a big and complicated area of web development. Luckily, modern audit tools are very feature-rich and developer-friendly.
PageSpeed Insights
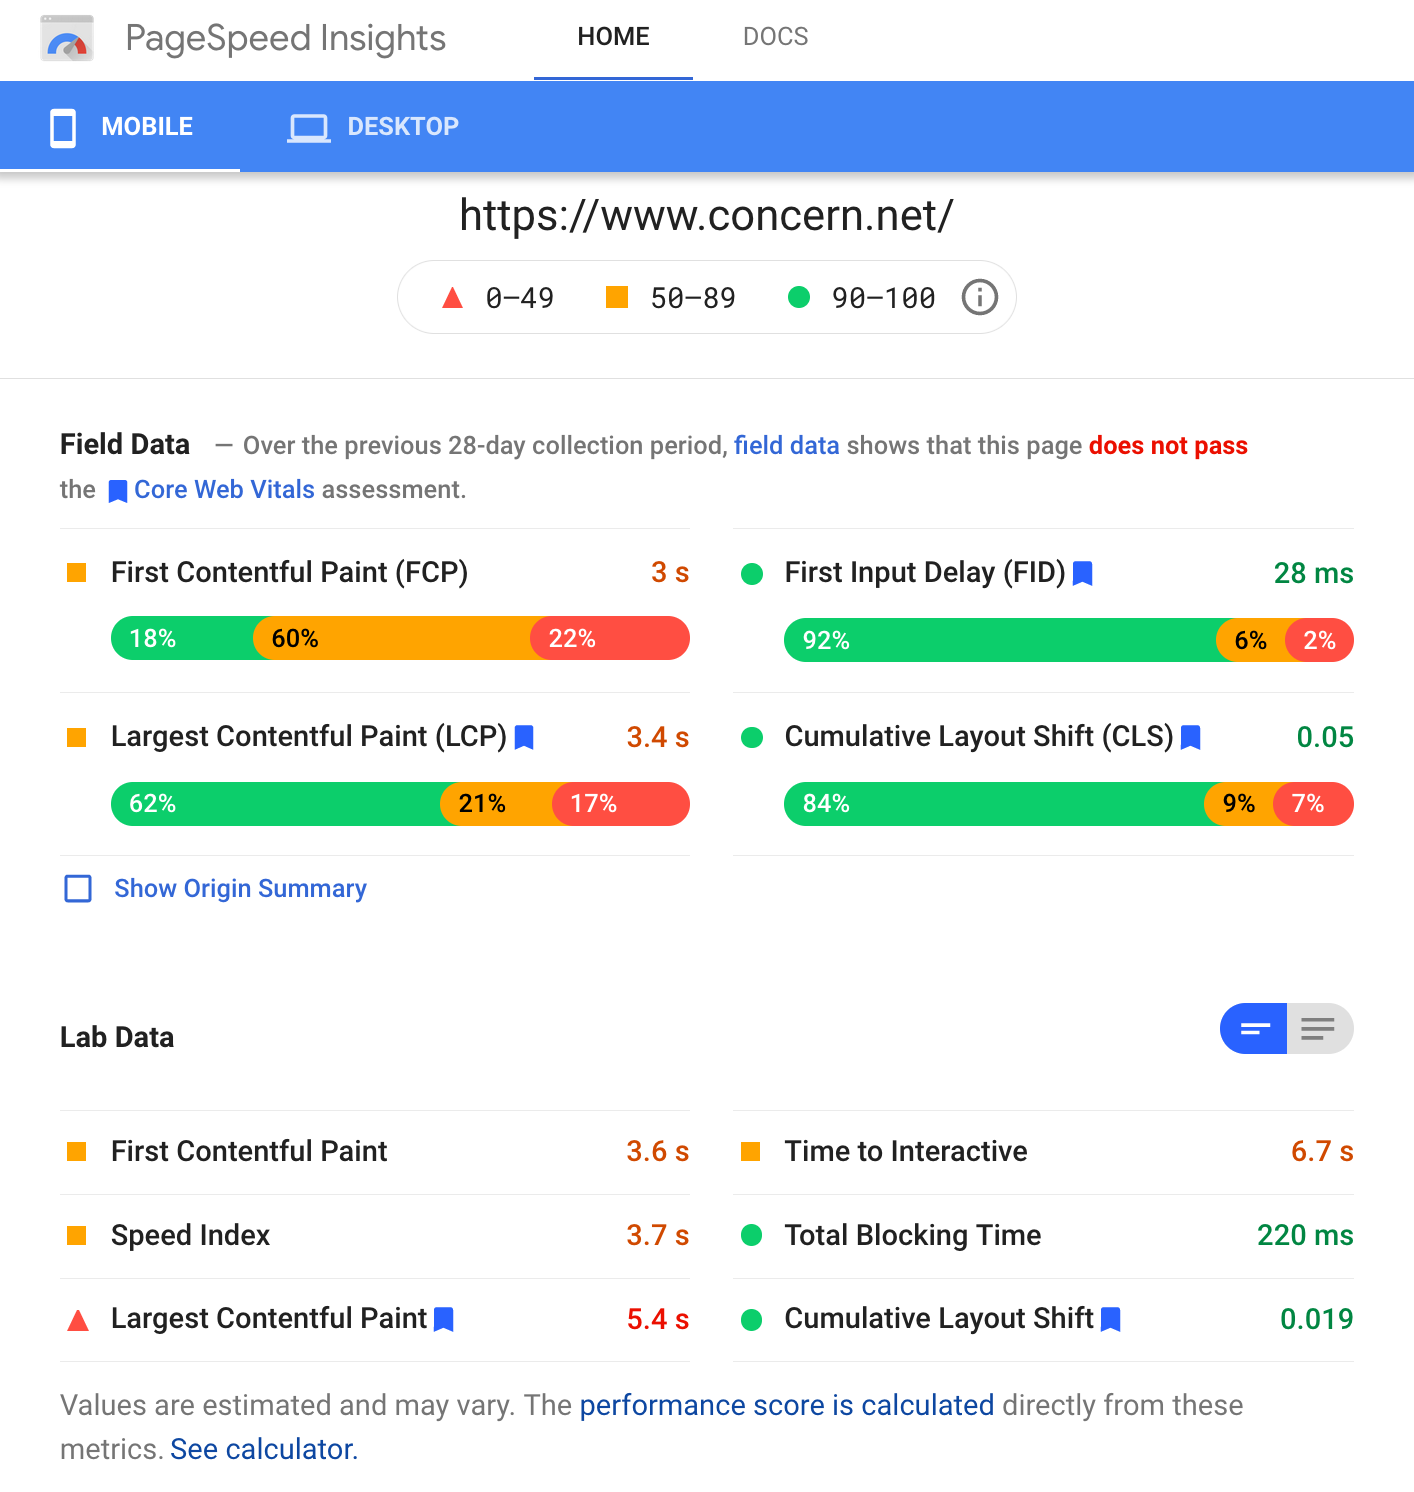
PageSpeed is another automated tool from Google focused on performance. In addition to the immediate performance score for a given website (so-called “Lab Data”) it shows real-world field data collected from real Chrome users. PageSpeed reports can be easily shared by URL.
WebPageTest
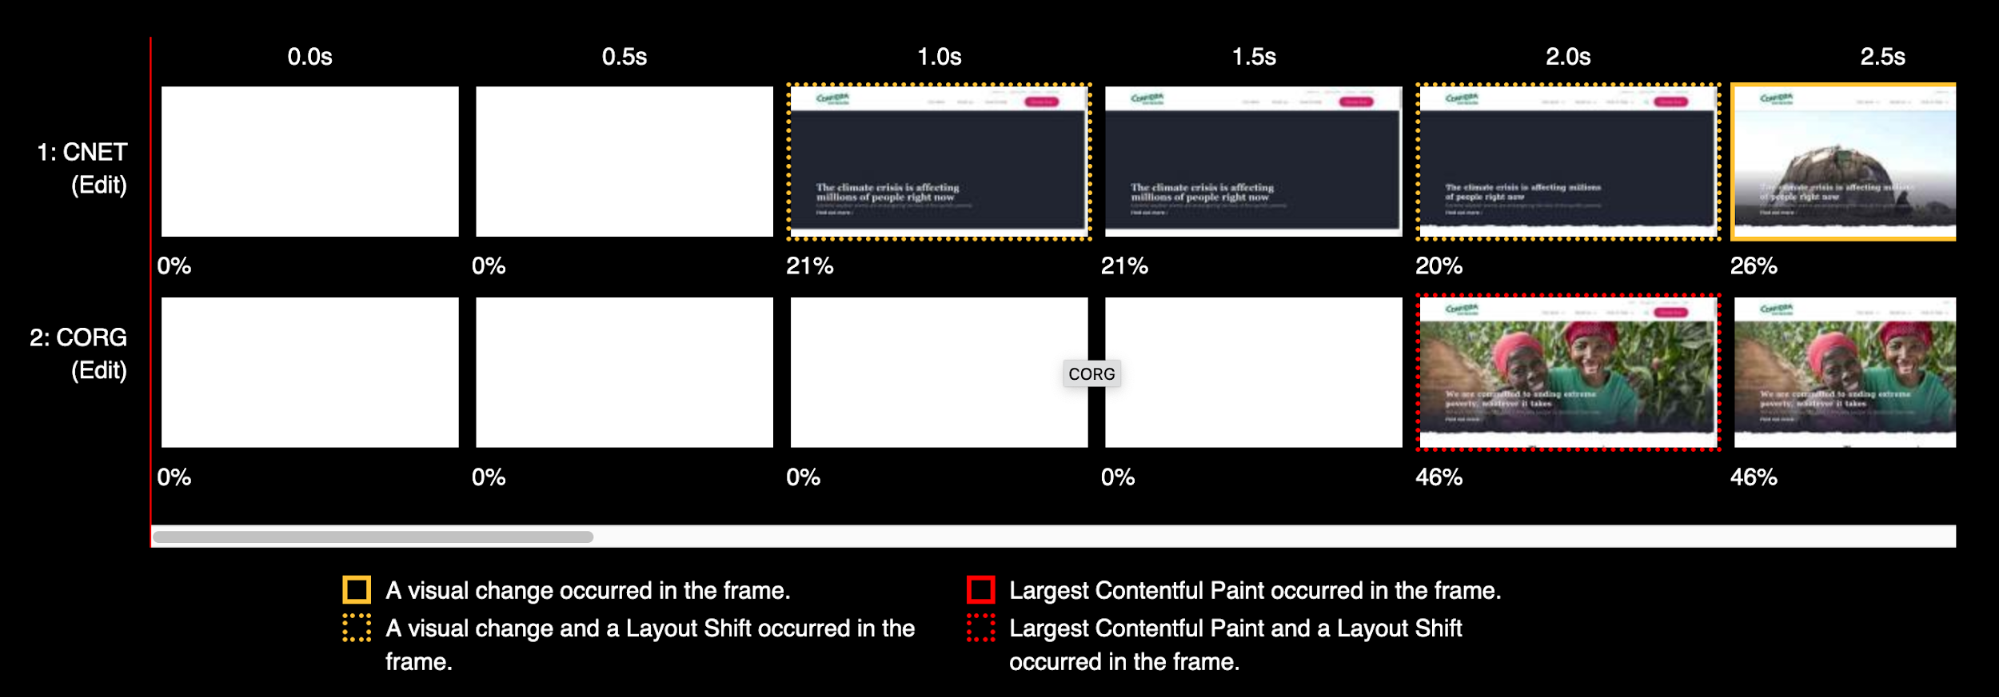
webpagetest.org has a few types of configurable web performance tests. You can choose from test location, device emulation, connection speed, etc. You can even program multi-step tests with custom scripts. My favourite WebPageTest feature is the Visual Comparison of 2+ URLs.
Search Console
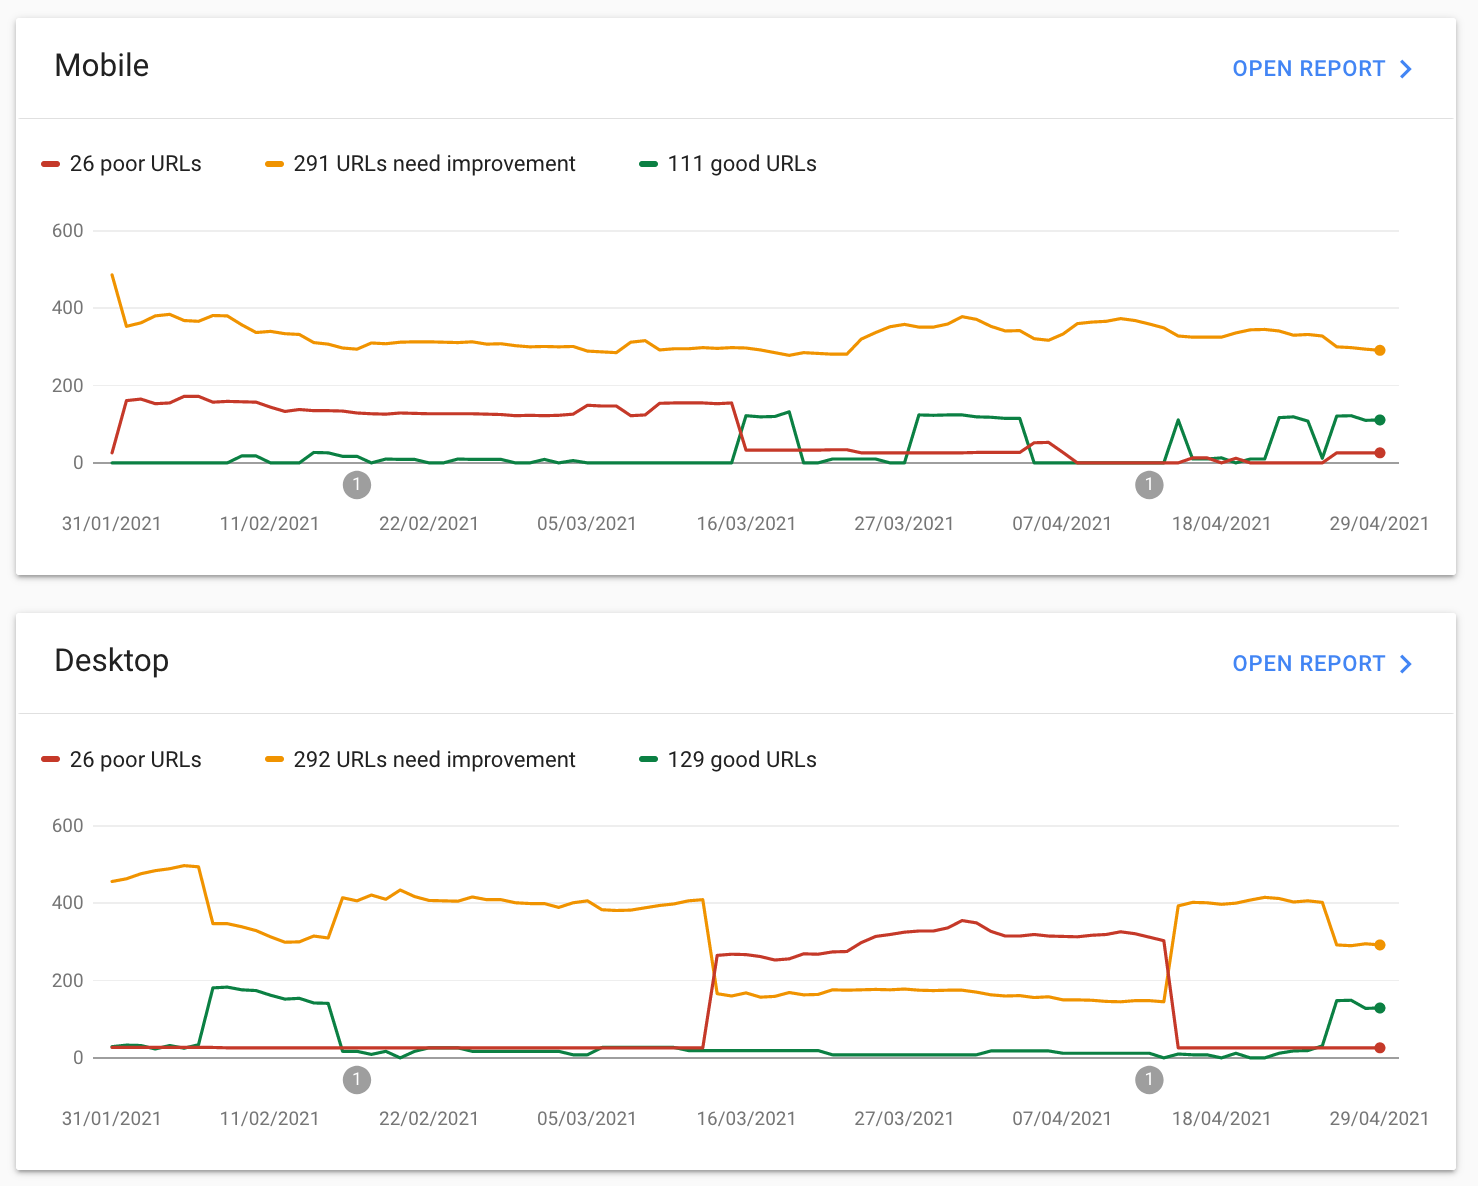
The “Core web vitals” report in Google Search Console is based on the same dataset as Field Data in PageSpeed Insights. In Search Console, you can see how site performance changes over time, which URLs perform poorly, and initiate re-validation when the fix is implemented. It's a must-have for public sites accessible via Google search.
Chrome DevTools Coverage
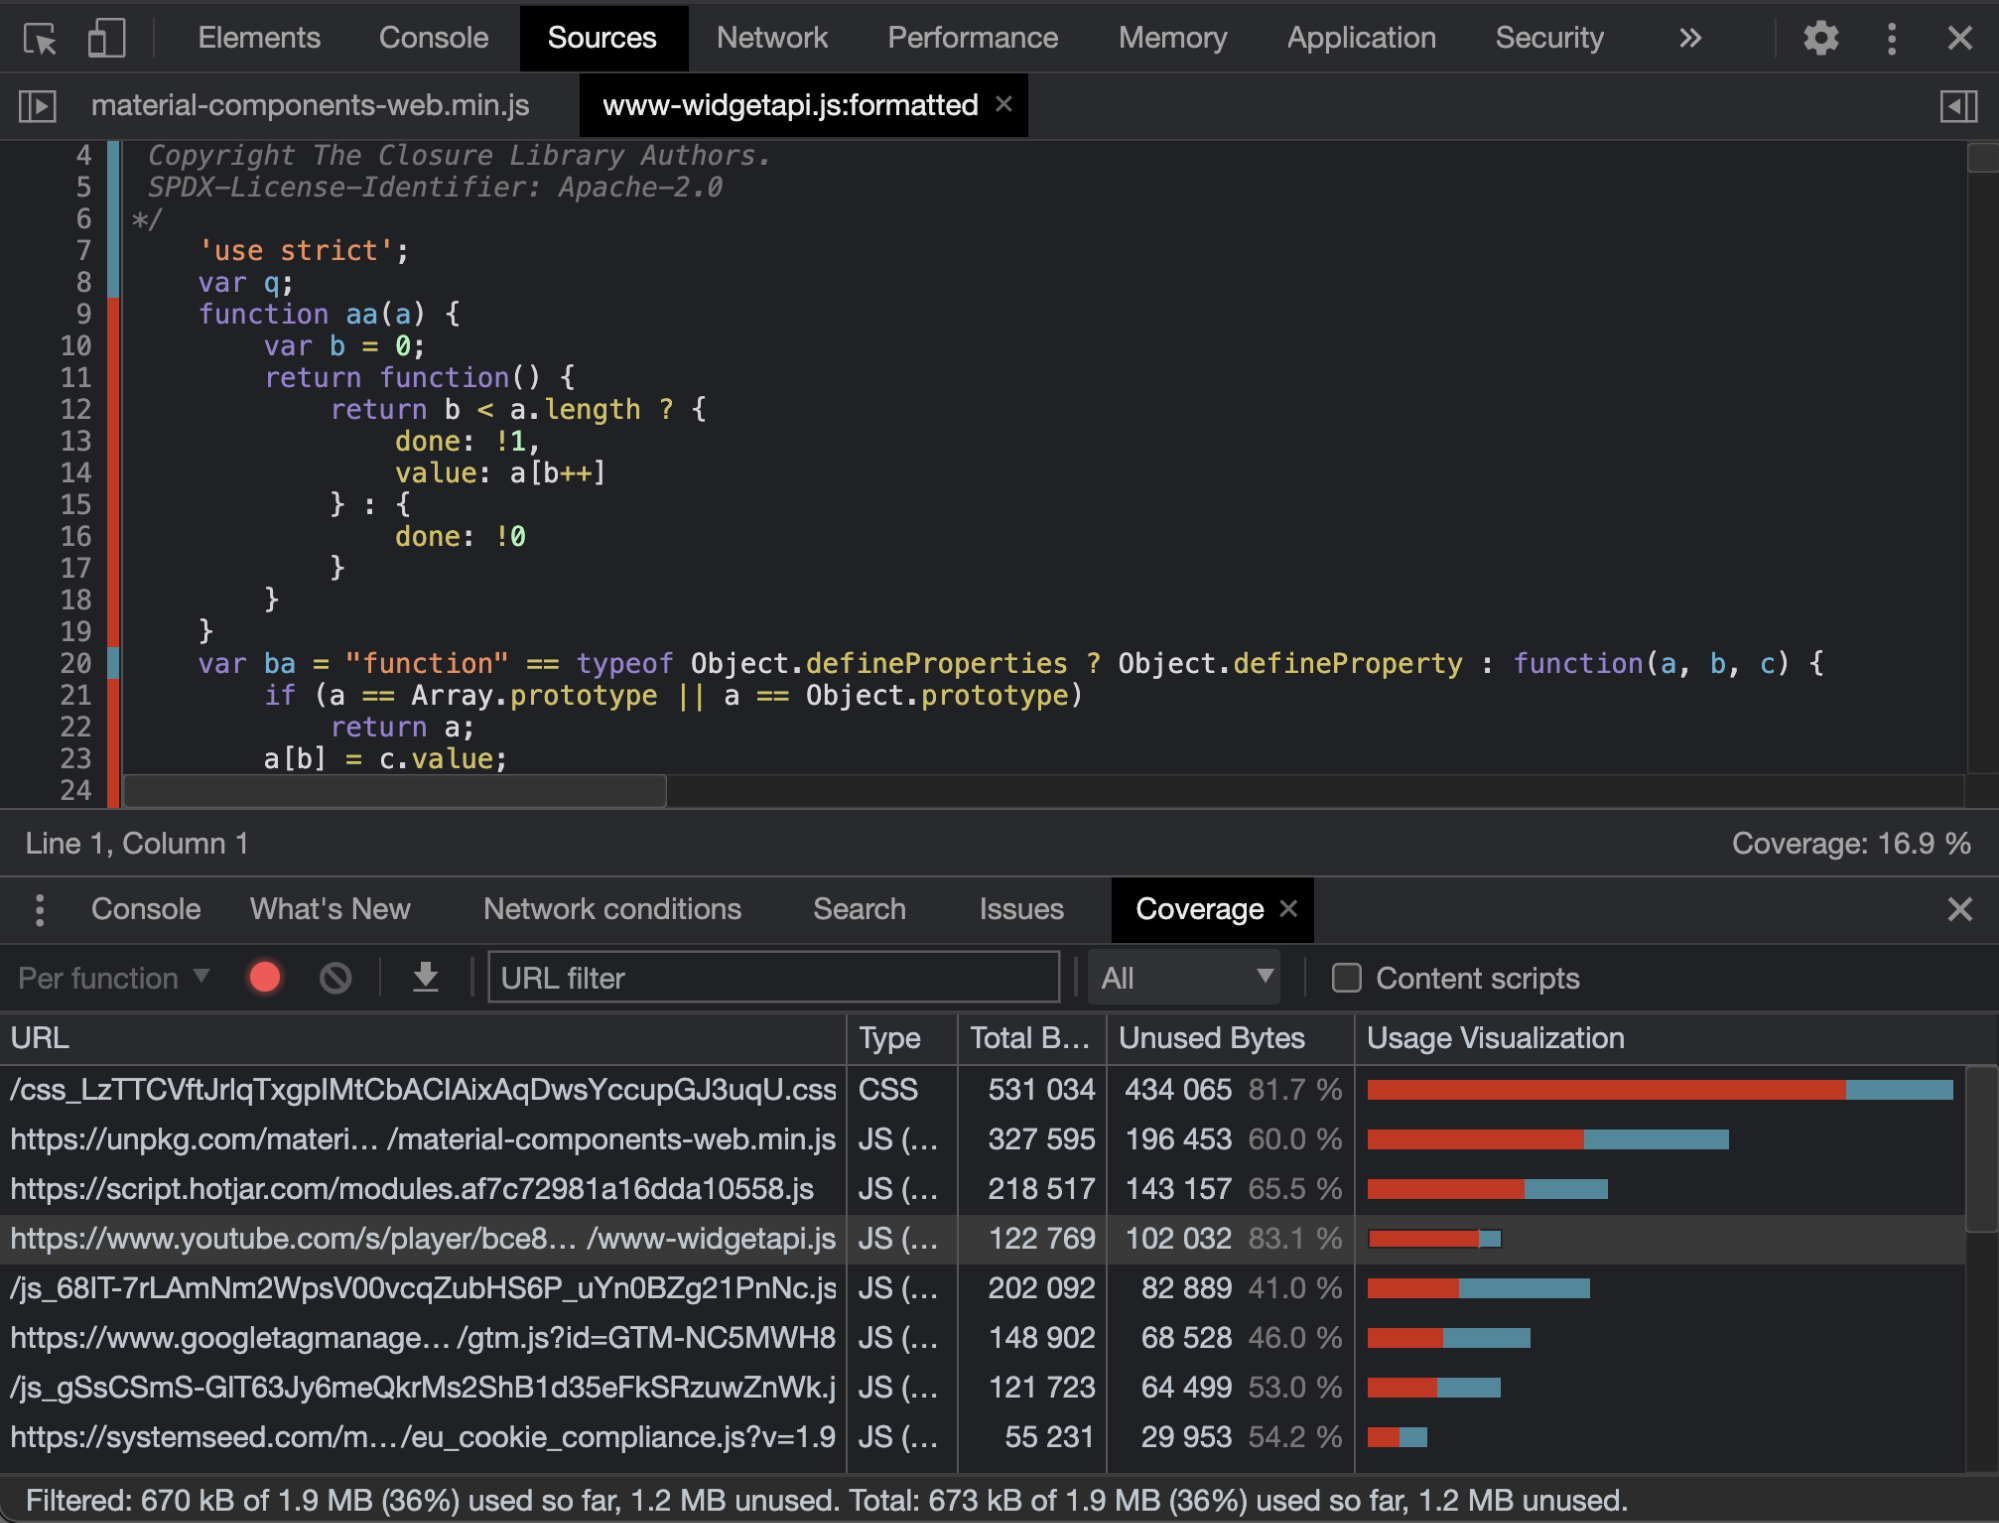
Chrome's Coverage is an amazing tool for identifying unused code. It generates a visual code usage report for each CSS & JS file and highlights specific blocks of code that were not used on the page.
To run the report, open any CSS or JS file in the Sources tab and click Coverage in the bottom-right corner. As you scroll down the page or navigate a single-page application, the coverage report is re-calculated automatically. Note down the files with the lowest coverage. There might be some obvious candidates for removal. For example, you can remove YouTube script from pages that don't have embed videos.
Don't get too obsessed with code coverage optimization. Focus on discovering the obvious anomalies.
Webpack Bundle Analyzer (or similar)
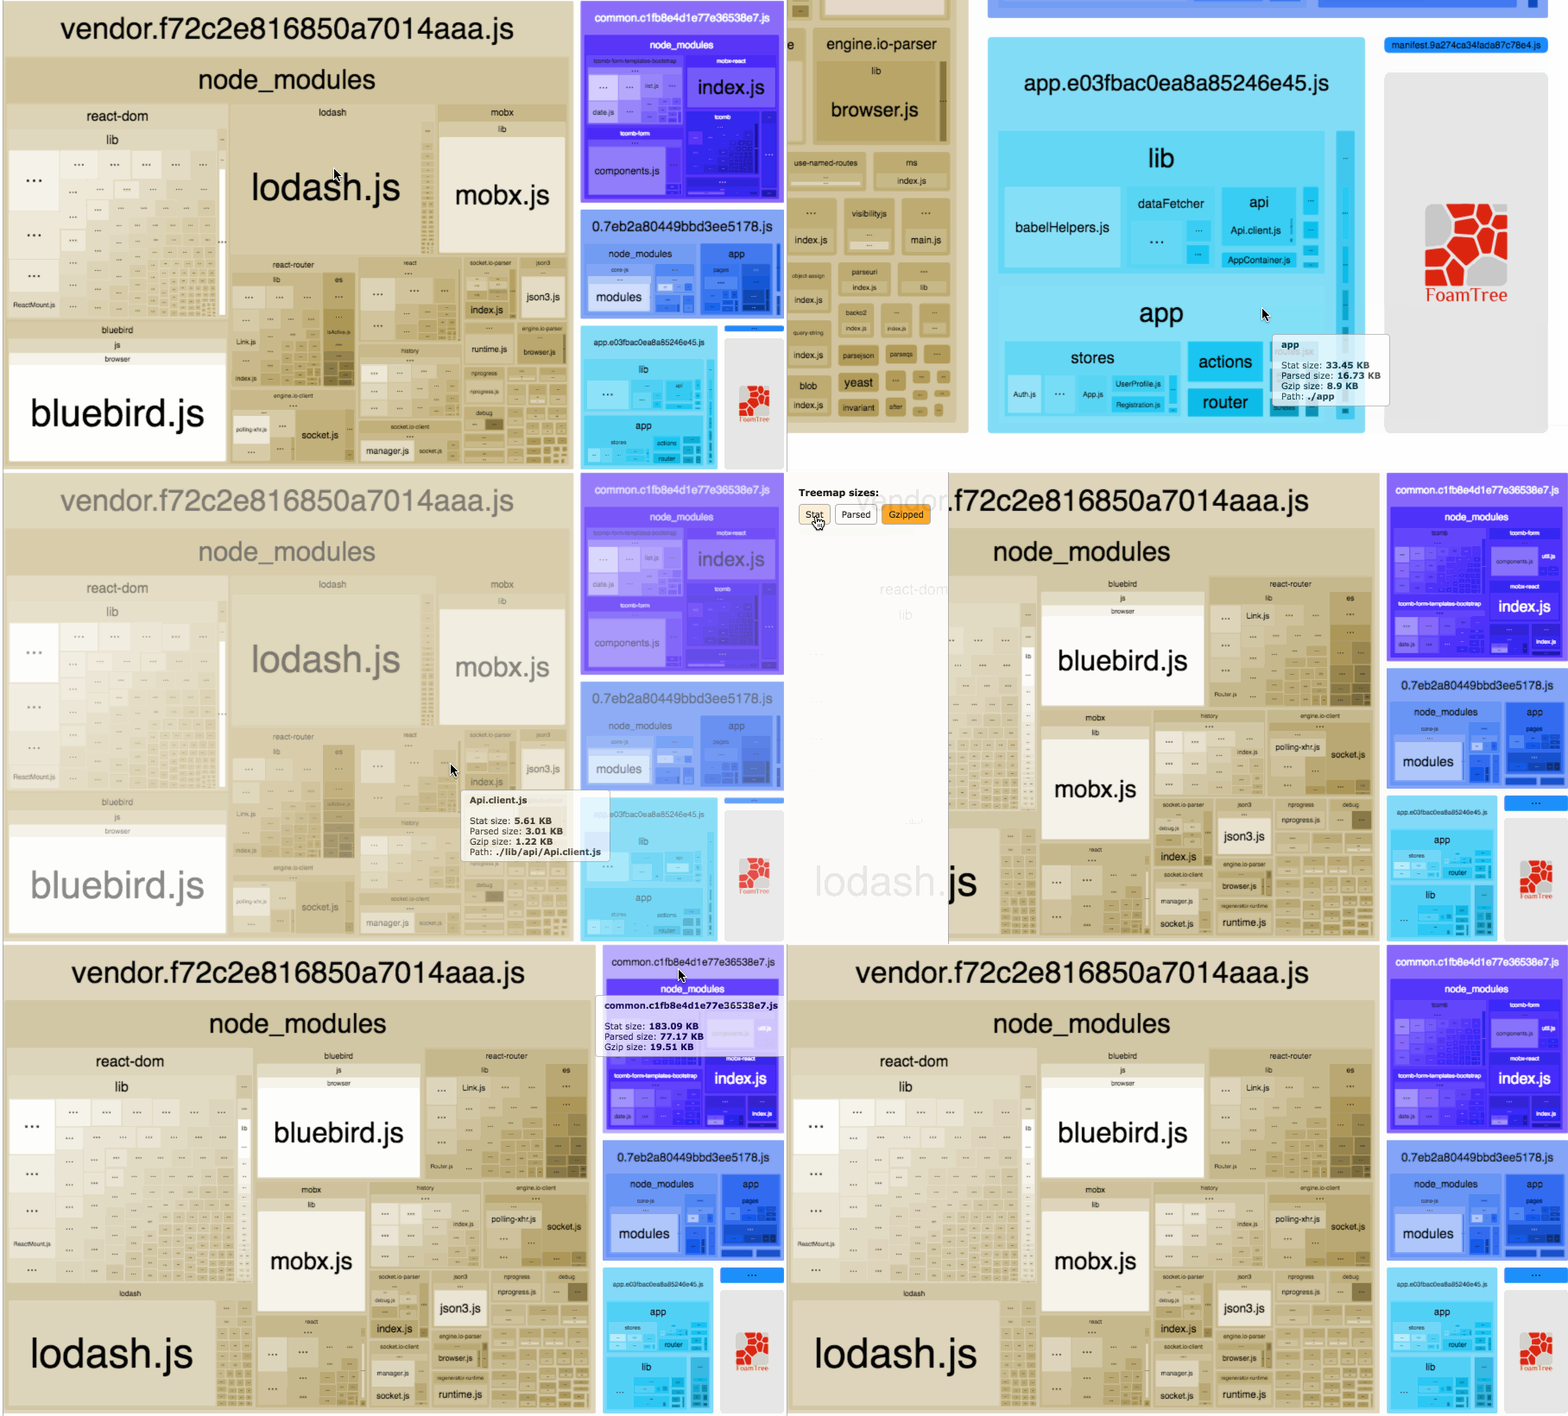
React applications are normally shipped in optimised JS chunks built by a bundler like Webpack or Rollup. Once you’ve identified big pieces of unused Javascript code, it's a good idea to figure out why all that code was included on the page. Webpack Bundle Analyzer is a perfect tool for this purpose. It's easy to configure (don't worry, you don't need to master Webpack) and it will tell you everything about your bundles!
In our Next.js projects, we add an analyze command in the package.json file to always to have bundle analyzer at hand:
"analyze": "BUNDLE_ANALYZE=true next build".
Source: https://github.com/webpack-contrib/webpack-bundle-analyzer#webpack-bundle-analyzer
Other JS bundlers have similar tools too, but Webpack Bundle Analyzer is the most advanced so far.
Chrome profiler
While tools like Chrome Coverage and Webpack Bundle Analyzer help to reduce the amount of the loaded code, a runtime performance profiler looks at the code that was actually loaded and executed. Chrome profiler gives in-depth information about the process of website rendering. This is where you can identify critical inefficiencies in your Javascript code.
The Chrome profiling timeline can look quite overwhelming at first, but in fact, you don't have to look into every cell and understand every metric to benefit from it.
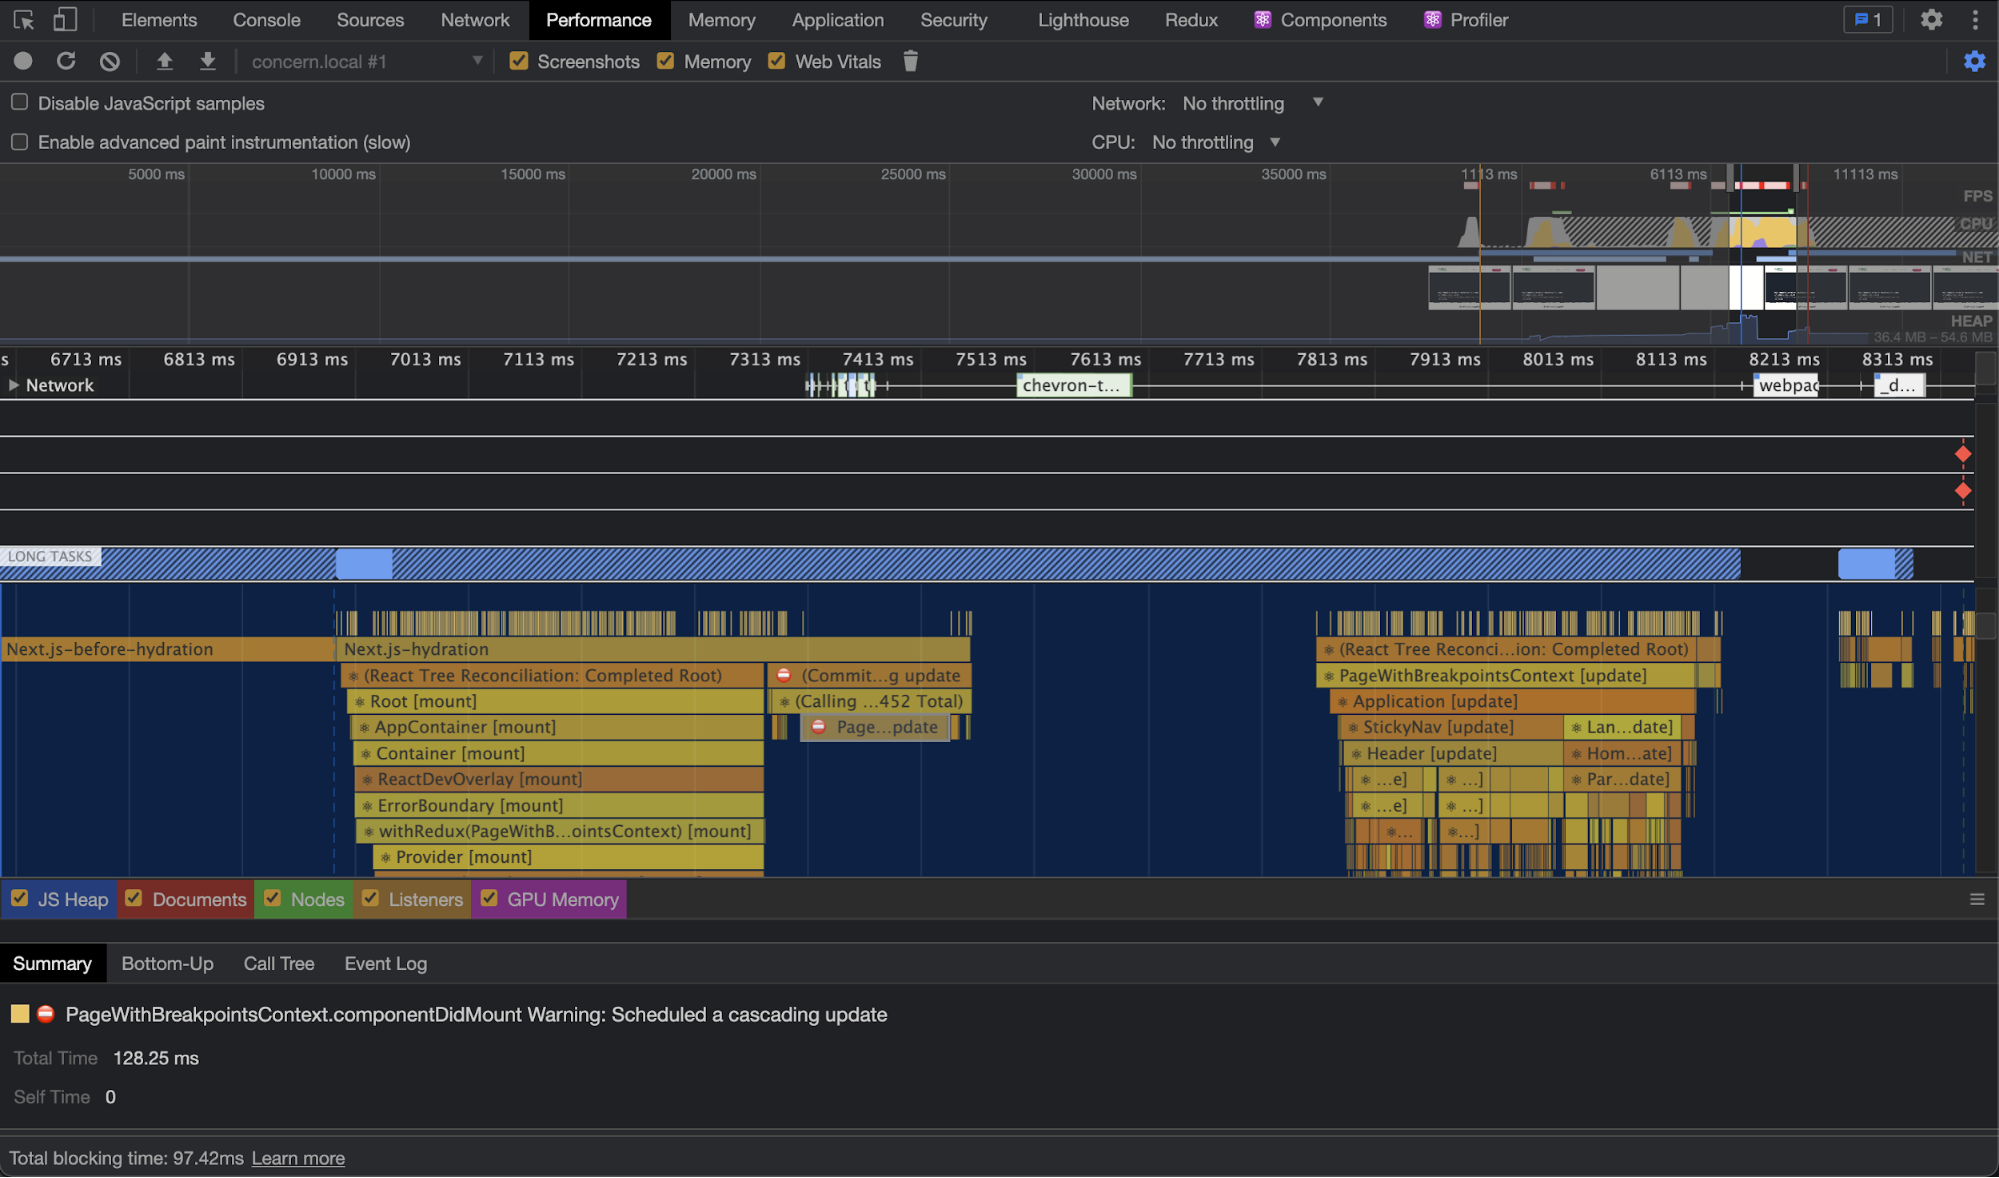
For example, on the screenshot below we see the Next.js app timing in dev mode (powered by User Timing API). It looks like the whole app is being re-rendered.
Chrome adds hints and warnings on the timeline to help developers identify performance bottlenecks. On the next screenshot, I clicked on the “Recalculate Style” warning for the same website profile and could see what had triggered recalculation. I was given the name of the Javascript function that I can optimize to get rid of the whole round of re-rendering. Exciting!
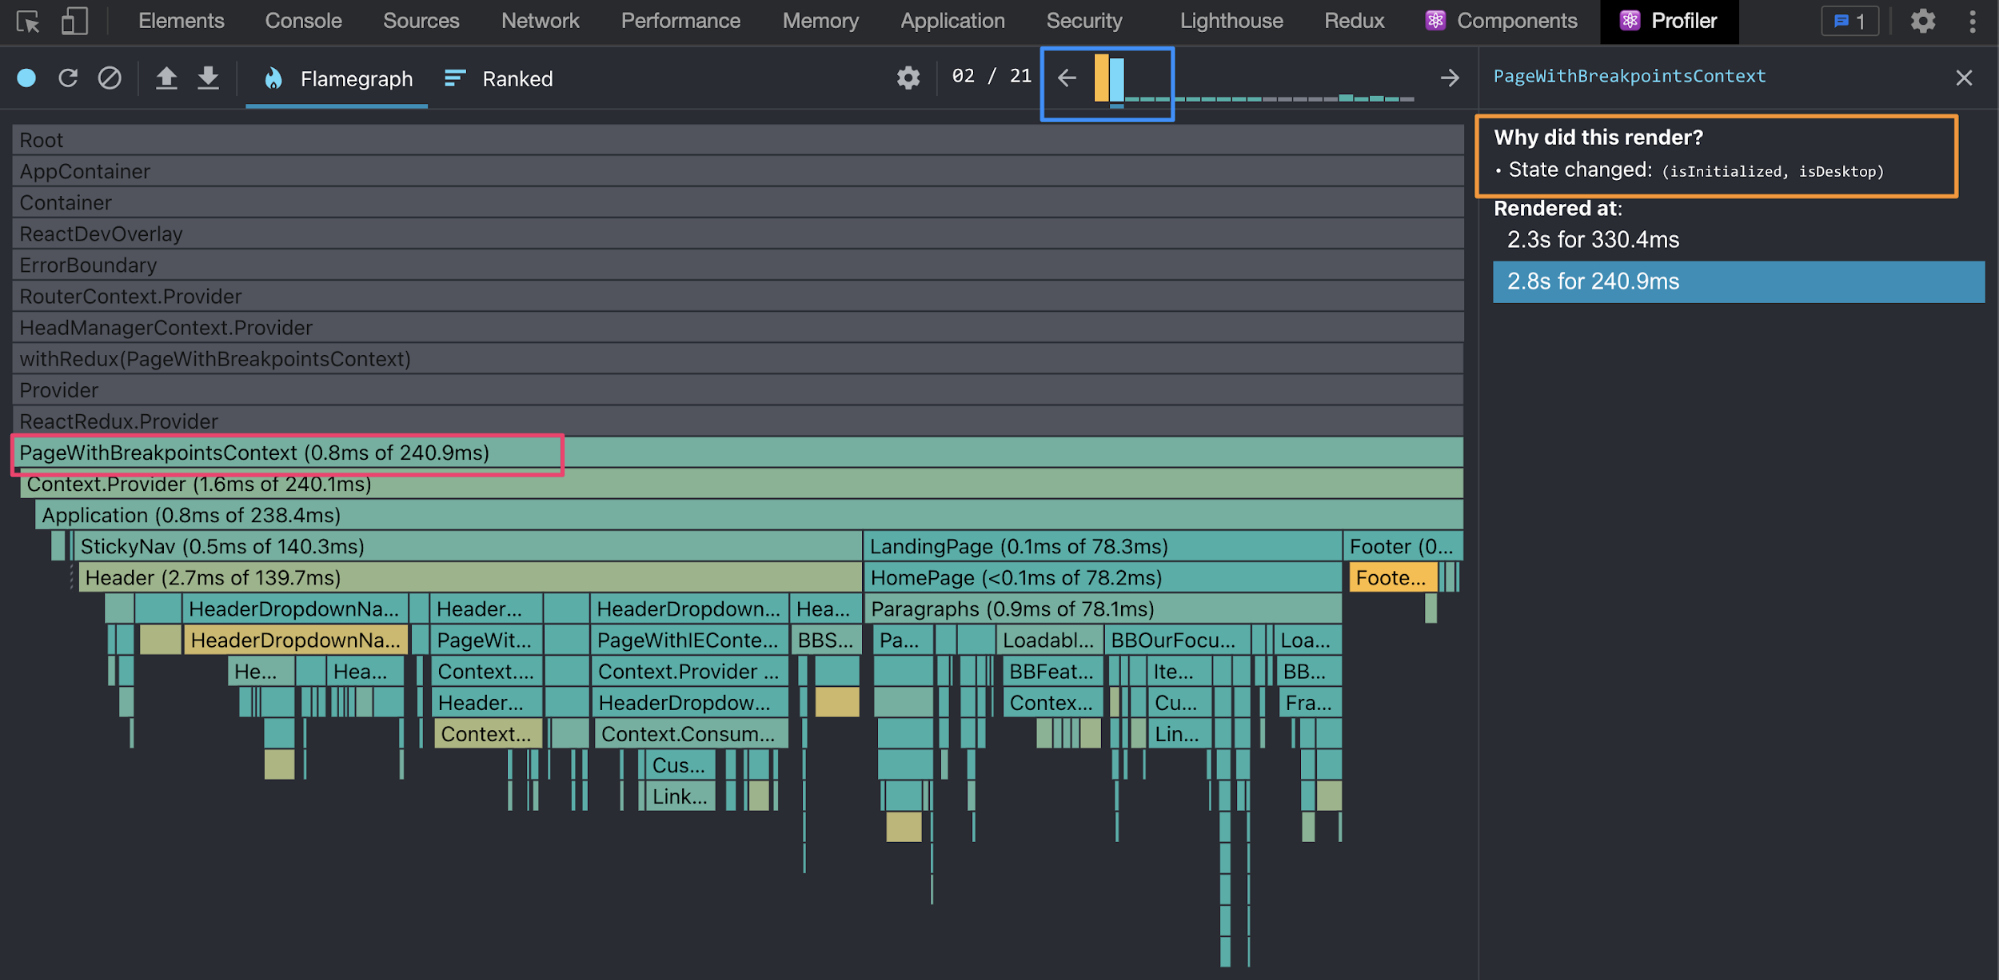
Similar insights can be gathered from the React Profiler. In the screenshot below I highlighted three areas with rectangles:
- Blue rectangle: number of renders. As we suspected, there are two renders on site load.
- Pink: the top component that is being re-rendered.
- Orange: the reason for re-render (some state values have been changed).
In many cases, issues like that will require refactoring. If it's the entire site re-render, then it's definitely worth it.
Final note
Performance optimization is a big and complicated area of web development. Luckily, modern audit tools are very feature-rich and developer-friendly. There are plenty of other libraries and services, free and paid, that help identify performance issues. The best strategy would be to combine a few of them and run regular audits to see how web performance changes as the site evolves.
This is it for part 2 of React Performance Optimization series on systemseed.com. Follow us on Twitter to read the next part as it gets published. Next time we will focus exclusively on Javascript!

